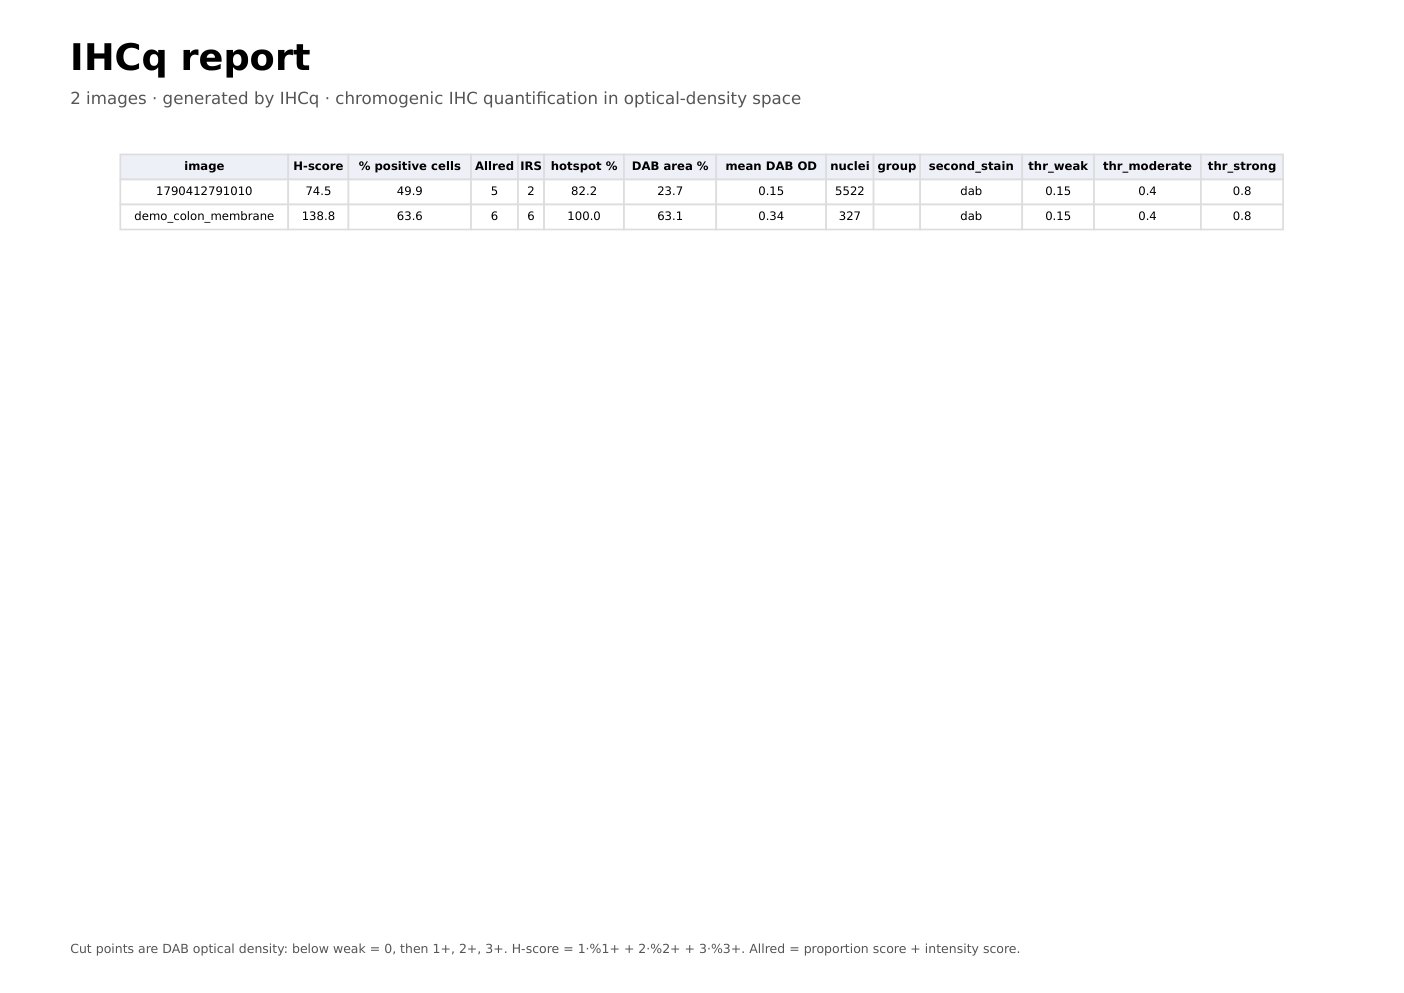
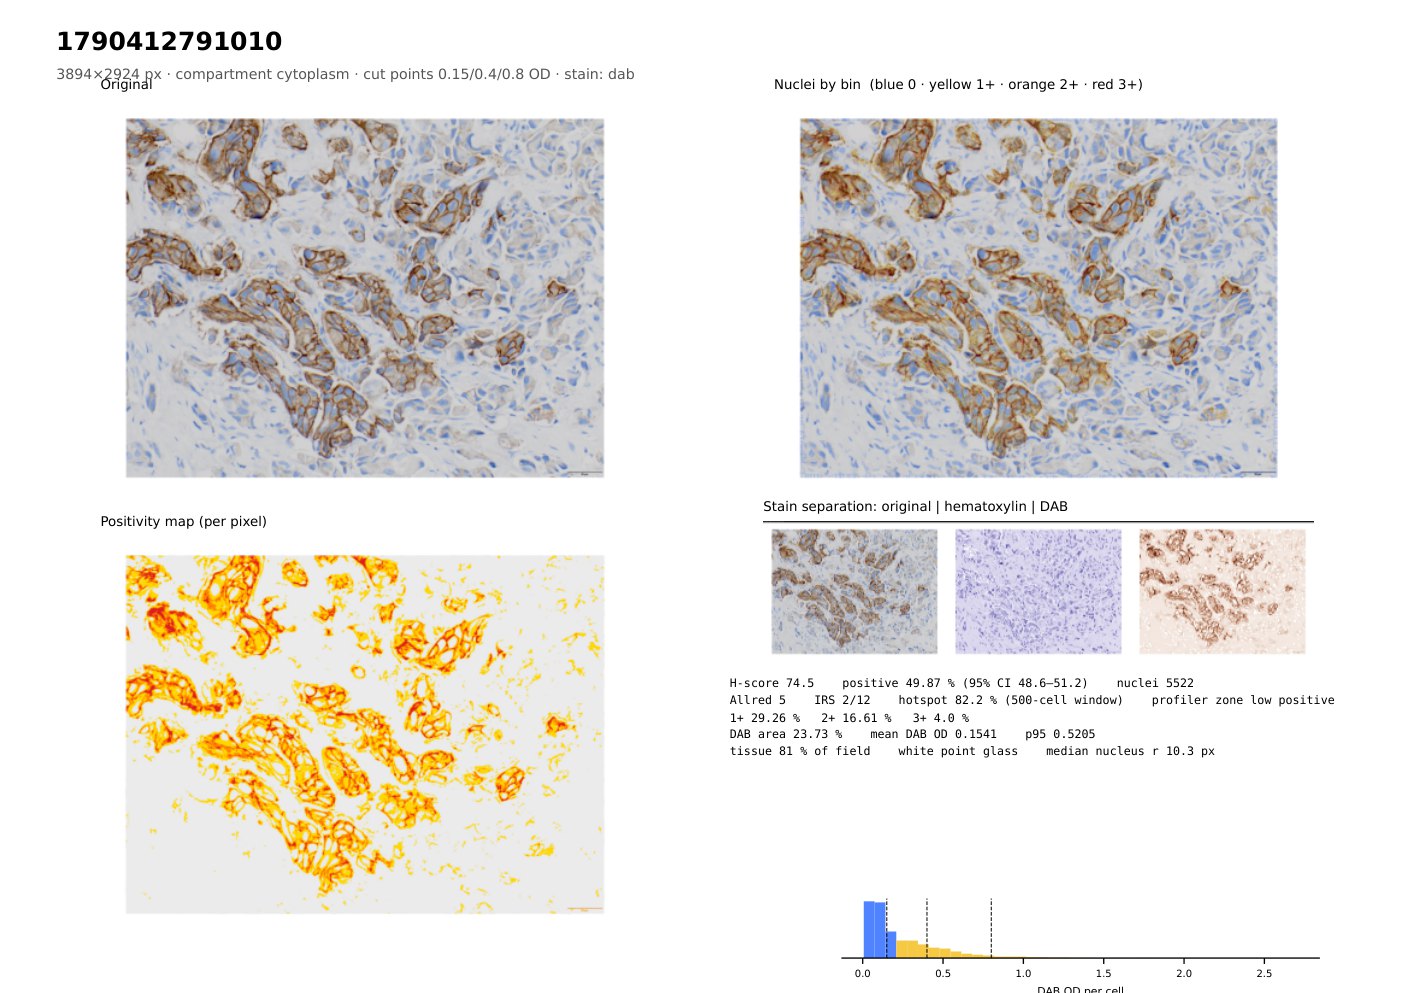
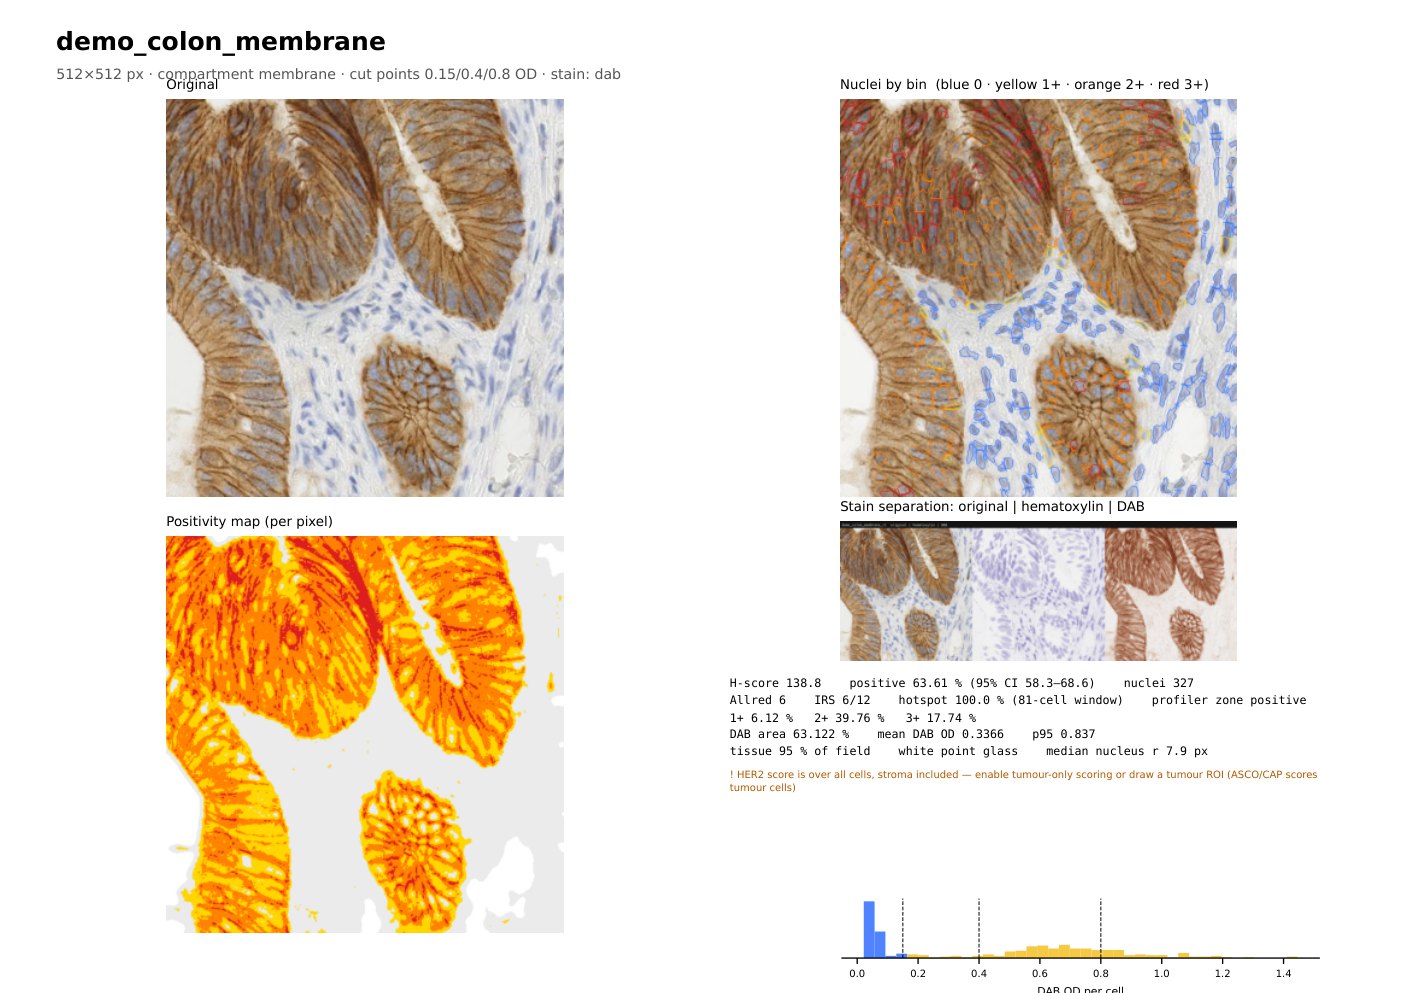
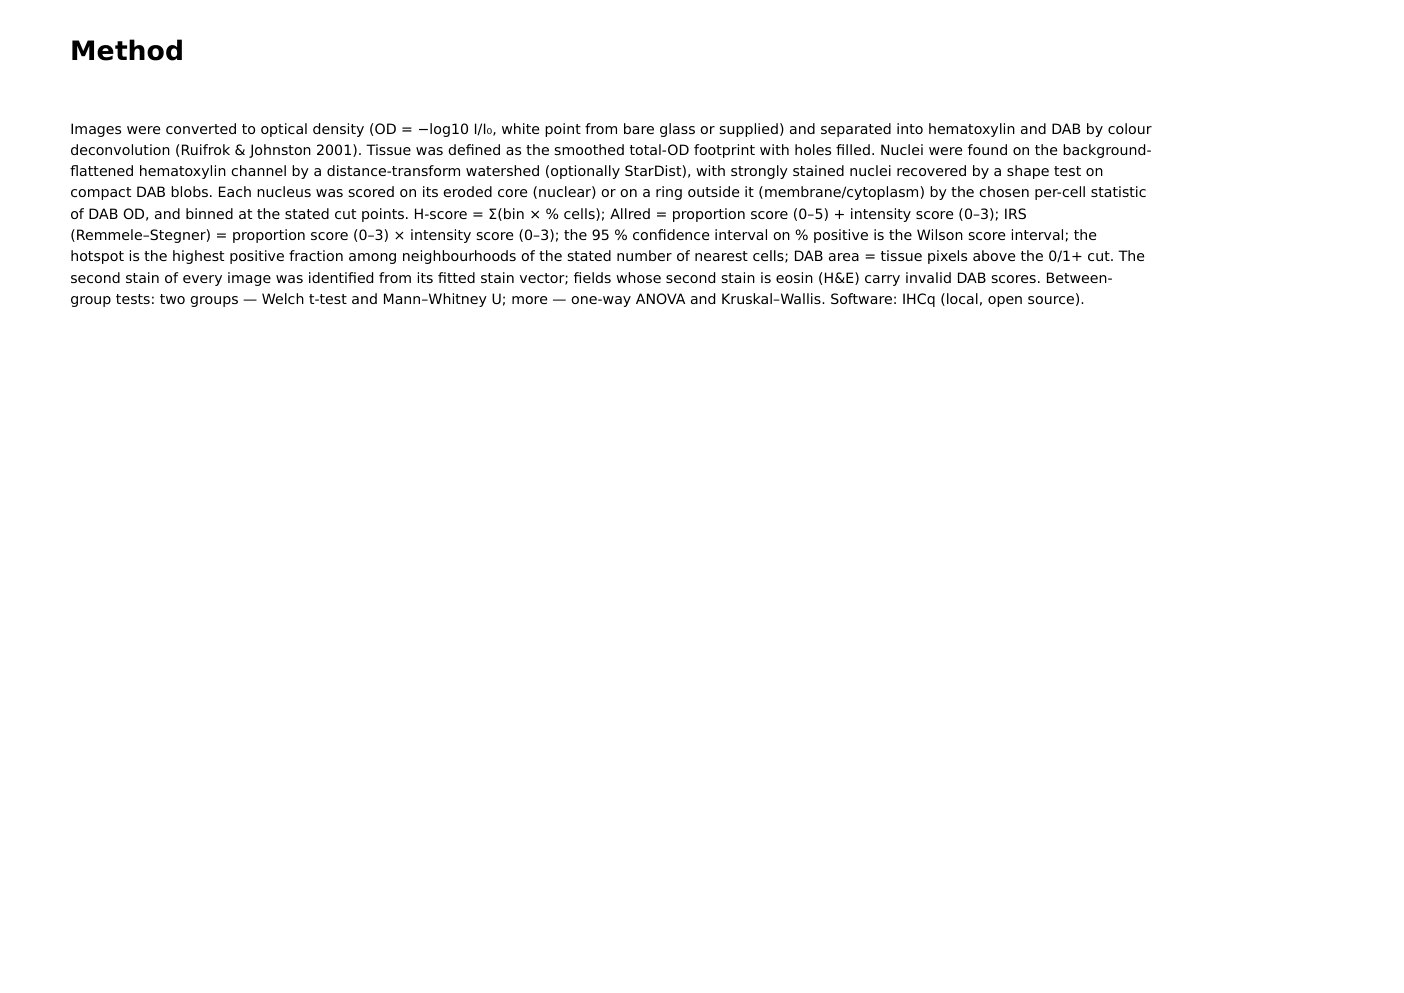
This image-based preview shows the kind of final report IHCq produces for a scoring session: a summary table of every image (H-score, % positive cells, Allred, IRS, hotspot, DAB area, mean DAB OD and nucleus count); for each image, the original field, every nucleus coloured by its intensity bin, a per-pixel positivity map, hematoxylin/DAB stain separation, the scores with a 95% confidence interval on % positive, and the per-cell DAB histogram with the cut points; and a written methods section (colour deconvolution after Ruifrok & Johnston 2001, per-cell compartment scoring, Wilson confidence intervals, between-group statistics).